Web Scraping Craigslist: A Complete Tutorial
I’ve been looking to make a move recently. And what better way to know I’m getting a good price than to sample from the “population” of housing on Craigslist? Sounds like a job for…Python and web scraping!
In this article, I’m going to walk you through my code that scrapes East Bay Area Craigslist for apartments. The code here, and/or the URI parameters rather, can be modified to pull from any region, category, property type, etc. Pretty cool, huh?
I’m going to share GitHub gists of each cell in the original Jupyter Notebook. If you’d like to just see the whole code at once, clone the repo. Otherwise, enjoy the read and follow along!
Getting the Data
First things first I needed to use the get module from the requests package. Then I defined a variable, response, and assigned it to the get method called on the base URL. What I mean by base URL is the URL at the first page you want to pull data from, minus any extra arguments. I went to the apartments section for the East Bay and checked the “Has Picture” filter to narrow down the search just a little though, so it’s not a true base URL.
I then imported BeautifulSoup from bs4, which is the module that can actually parse the HTML of the web page retrieved from the server. I then checked the type and length of that item to make sure it matches the number of posts on the page (there are 120). You can find my import statements and setup code below:
#import get to call a get request on the site
from requests import get

#get the first page of the east bay housing prices
response = get('https://sfbay.craigslist.org/search/eby/apa?hasPic=1&availabilityMode=0') #get rid of those lame-o's that post a housing option without a pic using their filter

from bs4 import BeautifulSoup
html_soup = BeautifulSoup(response.text, 'html.parser')

#get the macro-container for the housing posts
posts = html_soup.find_all('li', class_= 'result-row')
print(type(posts)) #to double check that I got a ResultSet
print(len(posts)) #to double check I got 120 (elements/page)
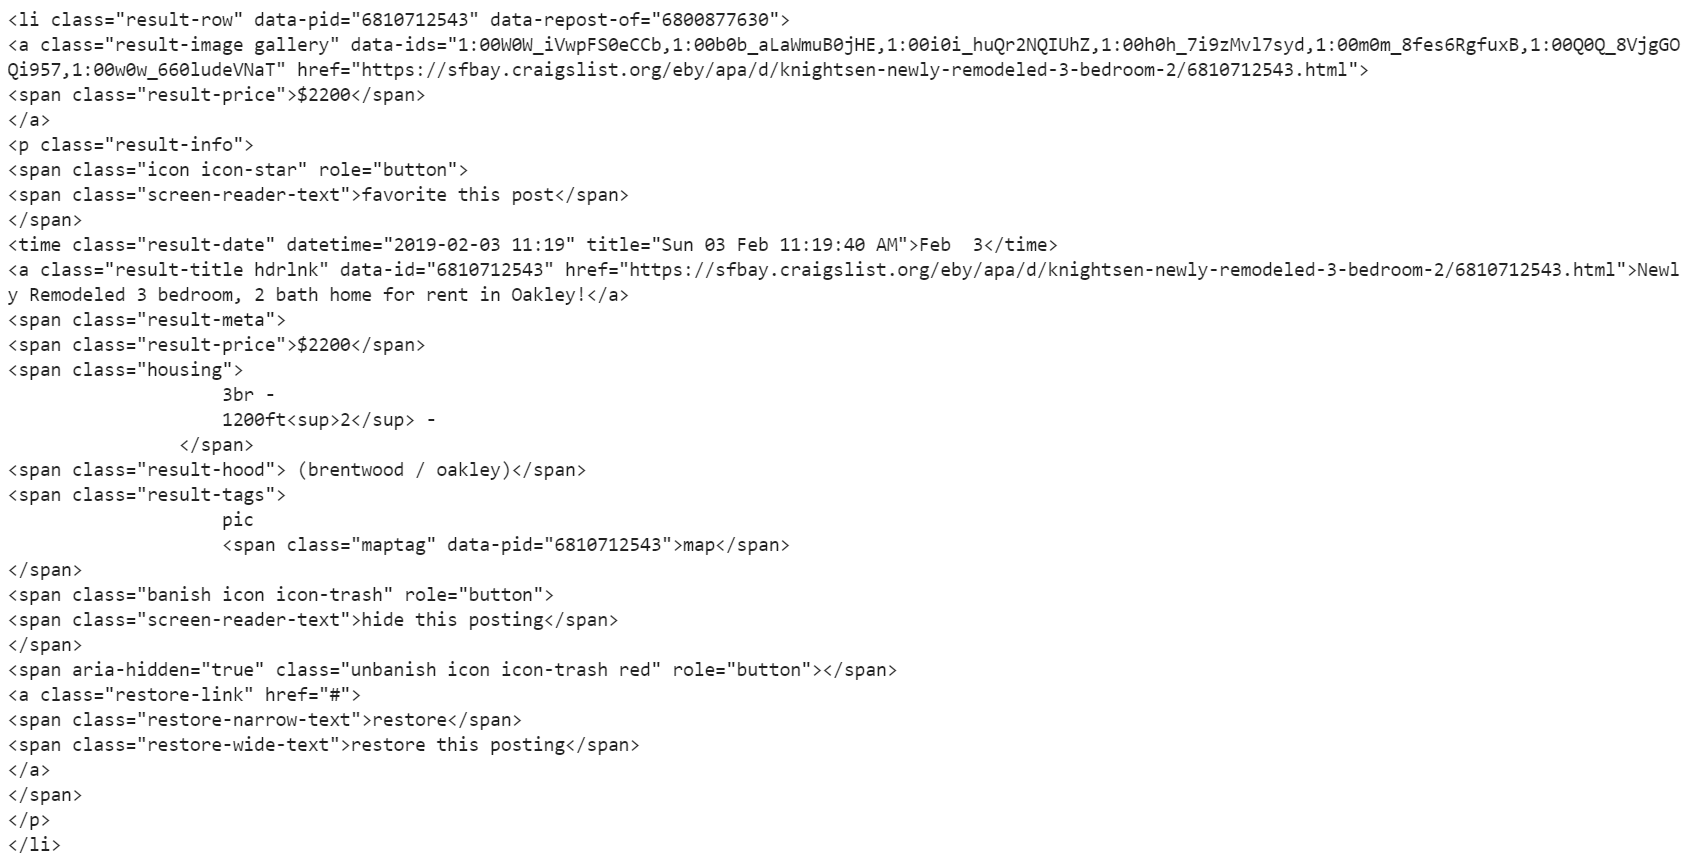
Using the find_all method on the newly created html_soup variable in the code above, I found the posts. I needed to examine the website’s structure to find the parent tag of the posts. Looking at the screenshot below, you can see that it’s


Element inspection with Chrome (Ctrl+Shift+C shortcut!)
In order to scale this, make sure to work in the following way: grab the first post and all the variables you want from it, make sure you know how to access each of them for one post before you loop the whole page, and lastly, make sure you successfully scraped one page before adding the loop that goes through all pages.
Class bs4.element.ResultSet is indexed, so I looked at the first apartment by indexing posts[0]. Surprise, it’s all the code that belongs to that

You should have this output for the first post in posts (posts[0]), assigned to post_one.
#grab the price of the first post
post_one_price = post_one.a.text
post_one_price.strip()
.strip() removes whitespace before and after a string
I grabbed the date and time by specifying the attribute ‘datetime’ on class ‘result-date’. By specifying the ‘datetime’ attribute, I saved a step in data cleaning by making it unnecessary to convert this attribute from a string to a datetime object. This could also be made into a one-liner by placing ['datetime'] at the end of the .find() call, but I split it into two lines for clarity.
#grab the time and datetime it was posted
post_one_time = post_one.find('time', class_= 'result-date')
post_one_datetime = post_one_time['datetime']
The URL and post title are easy because the ‘href’ attribute is the link and is pulled by specifying that argument. The title is just the text of that tag.
#title is a and that class, link is grabbing the href attribute of that variable
post_one_title = post_one.find('a', class_='result-title hdrlnk')
post_one_link = post_one_title['href']

#easy to grab the post title by taking the text element of the title variable
post_one_title_text = post_one_title.text
The number of bedrooms and square footage are in the same tag, so I split these two values and grabbed each one element-wise. The neighborhood is the tag of class “result-hood”, so I grabbed the text of that.
#grabs the whole segment of housing details. We will need missing value handling in the loop as this kind of detail is not common in posts
#the text can be split, and we can use indexing to grab the elements we want. number of bedrooms is the first element.
#sqft is the third element

post_one_num_bedrooms = post_one.find('span', class_ = 'housing').text.split()[0]

post_one_sqft = post_one.find('span', class_ = 'housing').text.split()[2][:-3] #cleans the ft2 at the end

post_one_hood = posts[0].find('span', class_='result-hood').text #grabs the neighborhood, this is the problem column that requires
#a lot of cleaning and figuring out later.
The next block is the loop for all the pages for the East Bay. Since there isn’t always information on square footage and number of bedrooms, I built in a series of if statements embedded within the for loop to handle all cases.
#build out the loop
from time import sleep
import re
from random import randint #avoid throttling by not sending too many requests one after the other
from warnings import warn
from time import time
from IPython.core.display import clear_output
import numpy as np

#find the total number of posts to find the limit of the pagination
results_num = html_soup.find('div', class_= 'search-legend')
results_total = int(results_num.find('span', class_='totalcount').text) #pulled the total count of posts as the upper bound of the pages array

#each page has 119 posts so each new page is defined as follows: s=120, s=240, s=360, and so on. So we need to step in size 120 in the np.arange function
pages = np.arange(0, results_total+1, 120)

iterations = 0

post_timing = []
post_hoods = []
post_title_texts = []
bedroom_counts = []
sqfts = []
post_links = []
post_prices = []

for page in pages:

    #get request
    response = get("https://sfbay.craigslist.org/search/eby/apt?"
                   + "s=" #the parameter for defining the page number
                   + str(page) #the page number in the pages array from earlier
                   + "&hasPic=1"
                   + "&availabilityMode=0")

    sleep(randint(1,5))

    #throw warning for status codes that are not 200
    if response.status_code != 200:
        warn('Request: {}; Status code: {}'.format(requests, response.status_code))

    #define the html text
    page_html = BeautifulSoup(response.text, 'html.parser')

    #define the posts
    posts = html_soup.find_all('li', class_= 'result-row')

    #extract data item-wise
    for post in posts:

        if post.find('span', class_ = 'result-hood') is not None:

            #posting date
            #grab the datetime element 0 for date and 1 for time
            post_datetime = post.find('time', class_= 'result-date')['datetime']
            post_timing.append(post_datetime)

            #neighborhoods
            post_hood = post.find('span', class_= 'result-hood').text
            post_hoods.append(post_hood)

            #title text
            post_title = post.find('a', class_='result-title hdrlnk')
            post_title_text = post_title.text
            post_title_texts.append(post_title_text)

            #post link
            post_link = post_title['href']
            post_links.append(post_link)

            #removes the \n whitespace from each side, removes the currency symbol, and turns it into an int
            post_price = int(post.a.text.strip().replace("$", ""))
            post_prices.append(post_price)

            if post.find('span', class_ = 'housing') is not None:

                #if the first element is accidentally square footage
                if 'ft2' in post.find('span', class_ = 'housing').text.split()[0]:

                    #make bedroom nan
                    bedroom_count = np.nan
                    bedroom_counts.append(bedroom_count)

                    #make sqft the first element
                    sqft = int(post.find('span', class_ = 'housing').text.split()[0][:-3])
                    sqfts.append(sqft)

                #if the length of the housing details element is more than 2
                elif len(post.find('span', class_ = 'housing').text.split()) > 2:

                    #therefore element 0 will be bedroom count
                    bedroom_count = post.find('span', class_ = 'housing').text.replace("br", "").split()[0]
                    bedroom_counts.append(bedroom_count)

                    #and sqft will be number 3, so set these here and append
                    sqft = int(post.find('span', class_ = 'housing').text.split()[2][:-3])
                    sqfts.append(sqft)

                #if there is num bedrooms but no sqft
                elif len(post.find('span', class_ = 'housing').text.split()) == 2:

                    #therefore element 0 will be bedroom count
                    bedroom_count = post.find('span', class_ = 'housing').text.replace("br", "").split()[0]
                    bedroom_counts.append(bedroom_count)

                    #and sqft will be number 3, so set these here and append
                    sqft = np.nan
                    sqfts.append(sqft)

                else:
                    bedroom_count = np.nan
                    bedroom_counts.append(bedroom_count)

                    sqft = np.nan
                    sqfts.append(sqft)

            #if none of those conditions catch, make bedroom nan, this won't be needed
            else:
                bedroom_count = np.nan
                bedroom_counts.append(bedroom_count)

                sqft = np.nan
                sqfts.append(sqft)
            #    bedroom_counts.append(bedroom_count)

            #    sqft = np.nan
            #    sqfts.append(sqft)

    iterations += 1
    print("Page " + str(iterations) + " scraped successfully!")

print("\n")

print("Scrape complete!")
The loop starts on the first page, and for each post in that page, it works through the following logic:

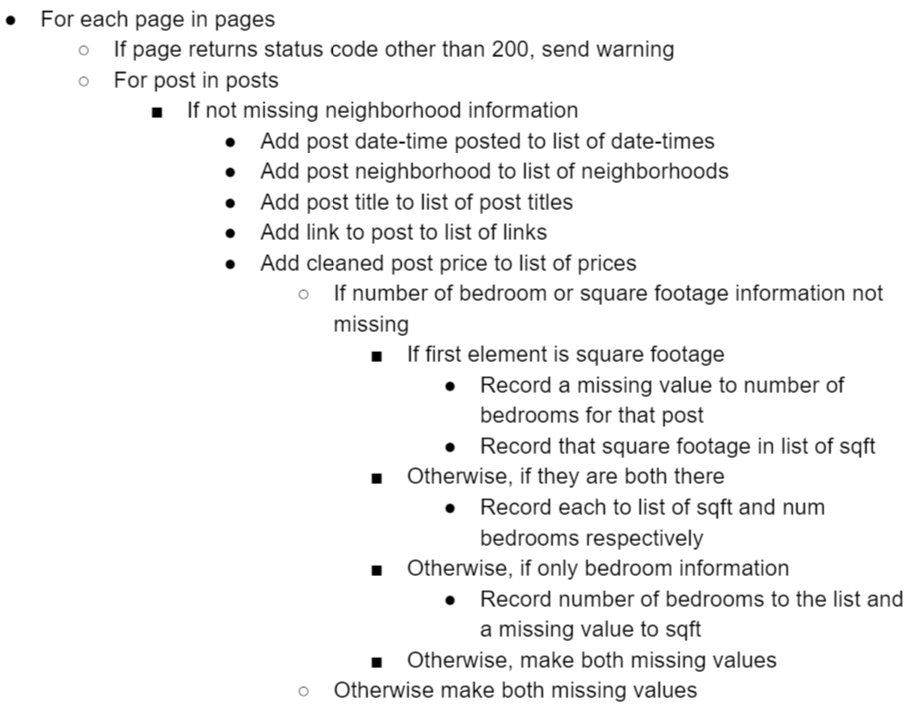
I included some data cleaning steps in the loop, like pulling the ‘datetime’ attribute and removing the ‘ft2’ from the square footage variable, and making that value an integer. I removed ‘br’ from the number of bedrooms as that was scraped as well. That way, I started data cleaning with some work already done. Elegant code is the best! I wanted to do more, but the code would become too specific to this region and might not work across areas.
The code below creates the dataframe from the lists of values!
import pandas as pd

eb_apts = pd.DataFrame({'posted': post_timing,
                       'neighborhood': post_hoods,
                       'post title': post_title_texts,
                       'number bedrooms': bedroom_counts,
                        'sqft': sqfts,
                        'URL': post_links,
                       'price': post_prices})
print(eb_apts.info())
eb_apts.head(10)

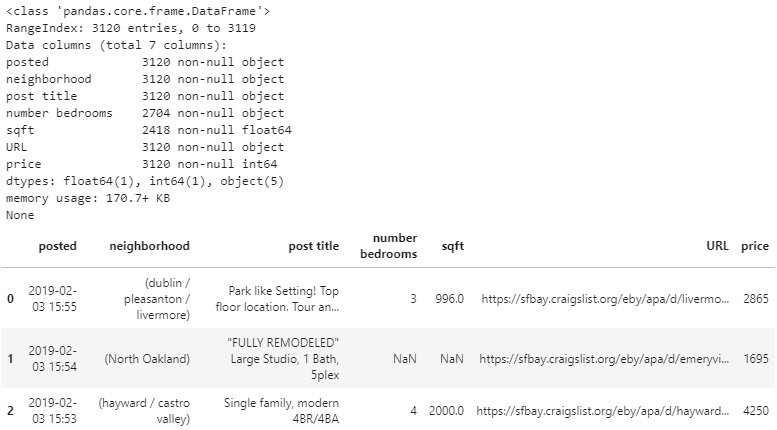
Awesome! There it is. Admittedly, there is still a little bit of data cleaning to be done. I’ll go through that real quick, and then it’s time to explore the data!
#first things first, drop duplicate URLs because people are spammy on Craigslist.
#Let's see how many uniqe posts we really have.
eb_apts = eb_apts.drop_duplicates(subset='URL')
len(eb_apts.drop_duplicates(subset='URL'))

#make the number bedrooms to a float (since np.nan is a float too)
eb_apts['number bedrooms'] = eb_apts['number bedrooms'].apply(lambda x: float(x))

#convert datetime string into datetime object to be able to work with it
from datetime import datetime

eb_apts['posted'] = pd.to_datetime(eb_apts['posted'])

#Looking at what neighborhoods there are with eb_apts['neighborhood'].unique() allowed me to see what
#I needed to deal with in terms of cleaning those.

#remove the parenthesis from the left and right of the neighborhoods
eb_apts['neighborhood'] = eb_apts['neighborhood'].map(lambda x: x.lstrip('(').rstrip(')'))

#titlecase them
eb_apts['neighborhood'] = eb_apts['neighborhood'].str.title()

#just take the first name of the neighborhood list, splitting on the '/' delimiter
eb_apts['neighborhood'] = eb_apts['neighborhood'].apply(lambda x: x.split('/')[0])

#fix one-offs that
eb_apts['neighborhood'].replace('Belmont, Ca', 'Belmont', inplace=True)
eb_apts['neighborhood'].replace('Hercules, Pinole, San Pablo, El Sob', 'Hercules', inplace=True)

#remove whitespaces
eb_apts['neighborhood'] = eb_apts['neighborhood'].apply(lambda x: x.strip())

#save the clean data
eb_apts.to_csv("eb_apts_1642_Jan_2_19_clean.csv", index=False)
Exploratory Data Analysis
Sadly, after removing the duplicate URLs I saw that there are only 120 instances. These numbers will be different if you run the code, since there will be different posts at different times of scraping. There were about 20 posts that didn’t have bedrooms or square footage listed too. For statistical reasons, this isn’t an incredible data set, but I took note of that and pushed forward.


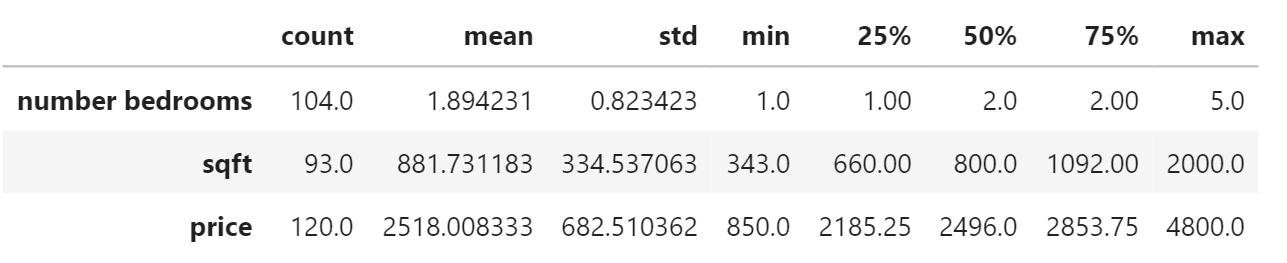
Descriptive statistics for the quantitative variables
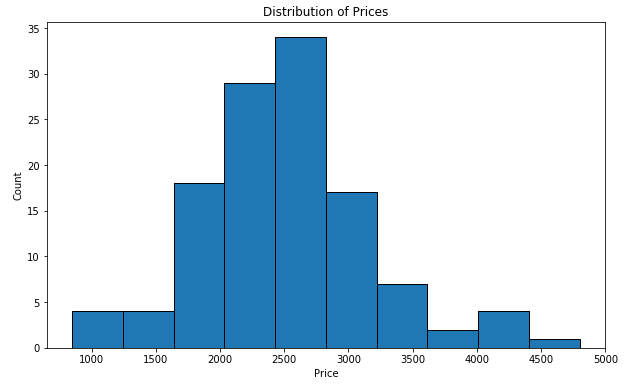
I wanted to see the distribution of the pricing for the East Bay so I made the above plot. Calling the .describe() method, I got a more detailed look. The cheapest place is $850, and the most expensive is $4,800.
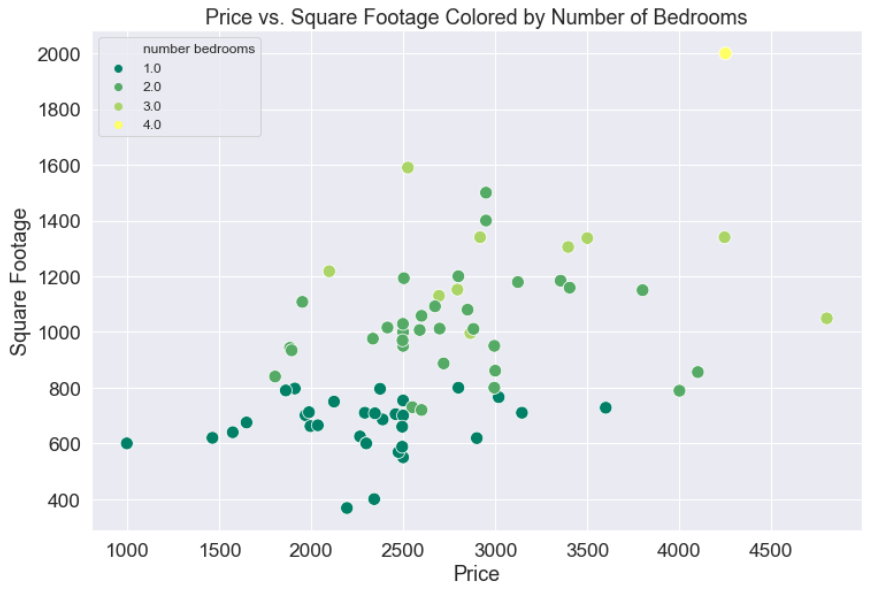
The next code block generates a scatter plot, where the points are colored by the number of bedrooms. This shows a clear and understandable stratification: we see layers of points clustered around particular prices and square footages, and as price and square footage increase so do the number of bedrooms.
import matplotlib.pylab as pylab
params = {'legend.fontsize': 'x-large',
          'figure.figsize': (15, 5),
         'axes.labelsize': 'x-large',
         'axes.titlesize':'x-large',
         'xtick.labelsize':'x-large',
         'ytick.labelsize':'x-large'}
pylab.rcParams.update(params)

plt.figure(figsize=(12, 8))
sns.scatterplot(x='price', y='sqft', hue='number bedrooms', palette='summer', x_jitter=True, y_jitter=True, s=125, data=eb_apts.dropna())
plt.legend(fontsize=12)
plt.xlabel("Price", fontsize=18)
plt.ylabel("Square Footage", fontsize=18);
plt.title("Price vs. Square Footage Colored by Number of Bedrooms", fontsize=18);

Let’s not forget the workhorse of Data Science: linear regression. We can call a regplot() on these two variables to get a regression line with a bootstrap confidence interval calculated about the line and shown as a shaded region with the code below. If you haven’t heard of bootstrap confidence intervals, they are a really cool statistical technique that are worth a read.
plt.figure(figsize=(12, 8))
sns.regplot(x='price', y='sqft', data=eb_apts.dropna());
plt.title('Price vs. Square Footage Regression Plot');
plt.xlabel("Price (USD)");
plt.ylabel("Square Feet");

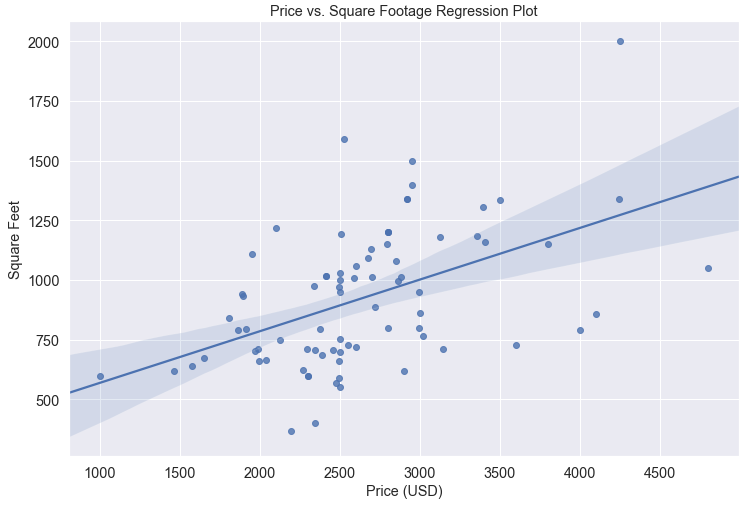
It looks like we have an okay fit of the line on these two variables. Let’s check the correlations. I called eb_apts.corr() to get these:

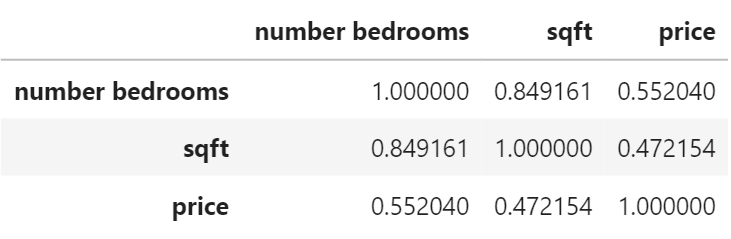
Correlation matrix for our variables
As suspected, correlation is strong between number of bedrooms and square footage. That makes sense since square footage increases as the number of bedrooms increases.
Pricing By Neighborhood Continued
I wanted to get a sense of how location affects price, so I grouped by neighborhood, and aggregated by calculating the mean for each variable.
The following is produced with this single line of code: eb_apts.groupby('neighborhood').mean() where ‘neighborhood’ is the ‘by=’ argument, and the aggregator function is the mean.

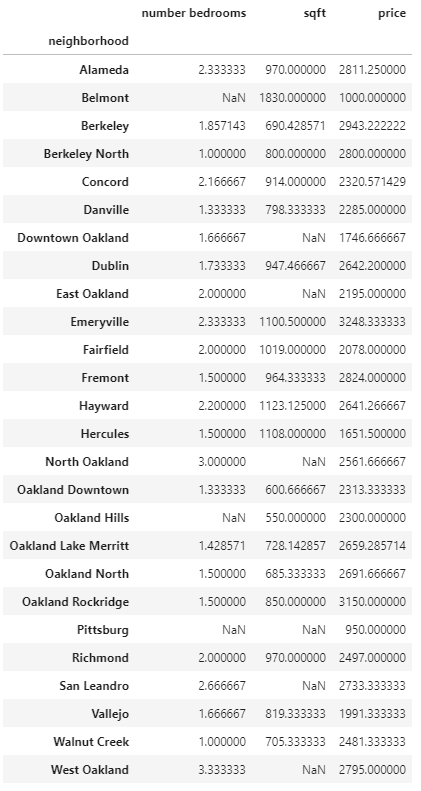
I noticed that there are two North Oaklands: North Oakland and Oakland North, so I recoded one of them into the other like so:
eb_apts['neighborhood'].replace('North Oakland', ‘Oakland North', inplace=True).
Grabbing the price and sorting it in ascending order can show the cheapest and most expensive places to live. The full line of code is now: eb_apts.groupby('neighborhood').mean()['price'].sort_values() and results in the following output:

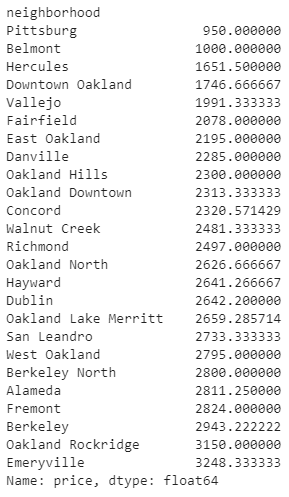
Average price by neighborhood sorted in ascending order
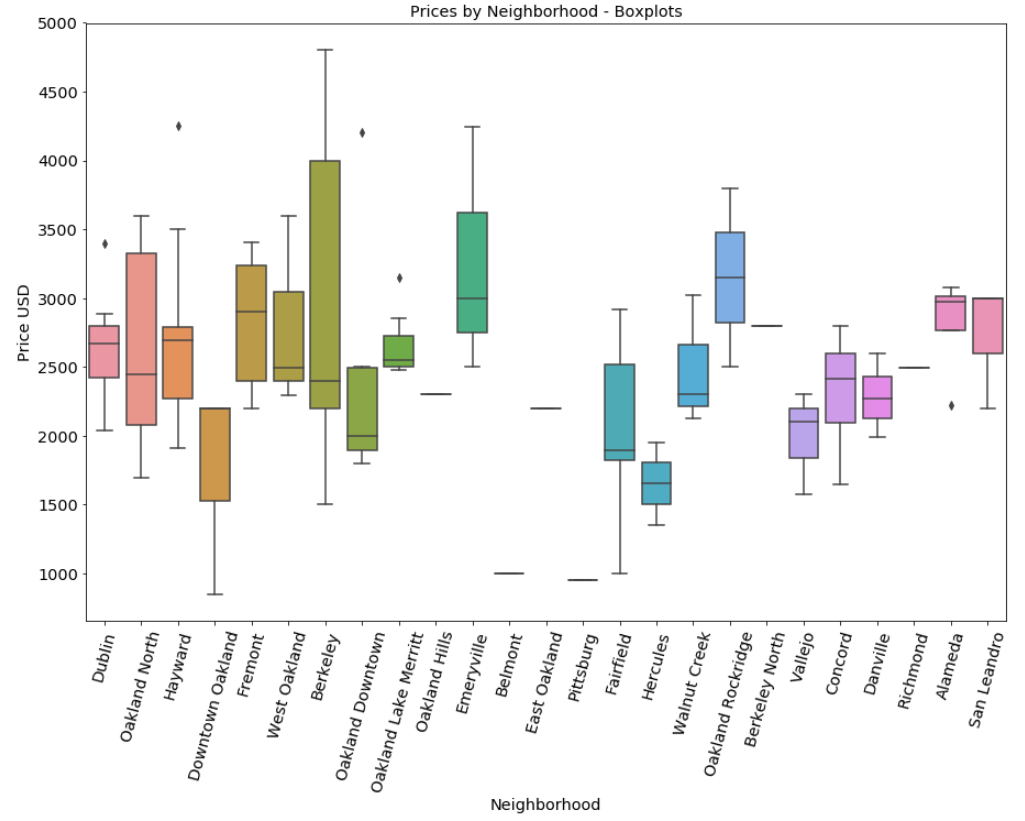
Lastly, I looked at the spread of each neighborhood in terms of price. By doing this, I saw how prices in neighborhoods can vary, and to what degree.
Here’s the code that produces the plot that follows.
sns.boxplot(x='neighborhood', y='price', data=eb_apts)
plt.xlabel("Neighborhood");
plt.xticks(rotation=75)
plt.ylabel("Price USD");
plt.title("Prices by Neighborhood - Boxplots");

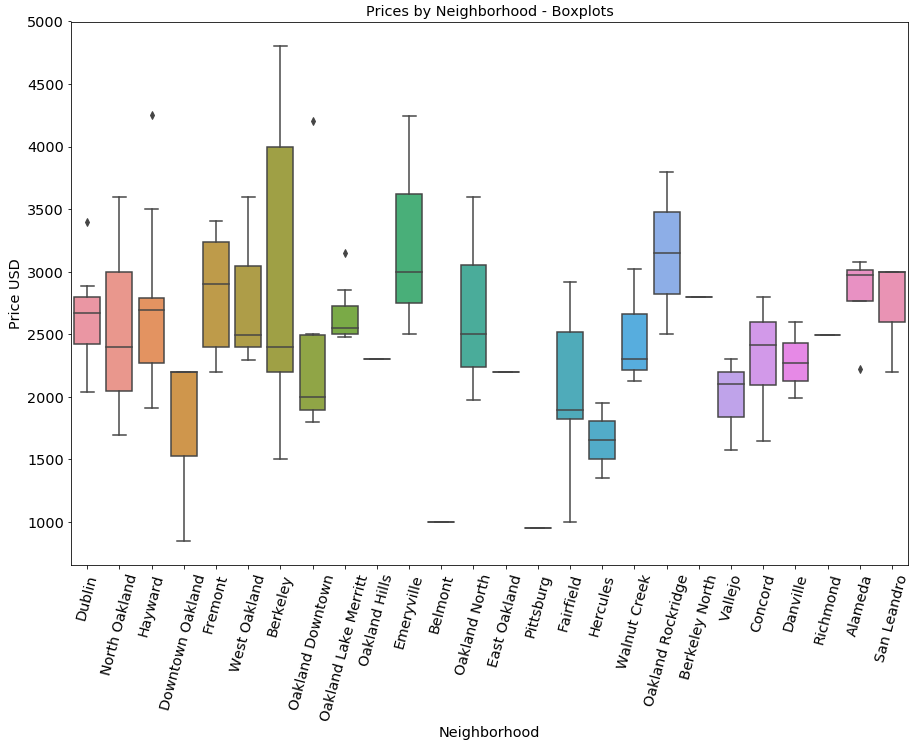
Berkeley had a huge spread. This is probably because it includes South Berkeley, West Berkeley, and Downtown Berkeley. In a future version of this project it may be important to consider changing the scope of each of the variables so they are more reflective of the variability of price between neighborhoods in each city.
Well, there you have it! Take a look at this the next time you’re in the market for housing to see what a good price should be. Feel free to check out the repo and try it for yourself, or fork the project and do it for your city! Let me know what you come up with!
